A Proud NinjaTrader® Ecosystem Vendor

A Portfolio Approach to
Automated Futures Trading.

A professionally engineered portfolio of proprietary NinjaTrader® strategies designed to operate together as a diversified automated trading system. Two tracks: micro engines built for the $2K prop limit, and mini engines designed to stay under $20K on any account.

✓ Runs on NinjaTrader® — install it and go ✓ Hands-free: it enters, exits, and is flat overnight ✓ For evaluation, funded, or your own account
What this is

Seven rules-based strategies that trade futures automatically inside NinjaTrader® — on your own machine, on your own account. You install them and they take their own entries and exits, and go flat overnight.

Who it’s for

Micro: traders on a $50K evaluation or funded account, working inside a $2,000 drawdown limit. Mini: traders on their own account or a large prop account, on full-size contracts. Both would rather follow a published record than chase the next signal service.

What it’s built for

Keeping an account alive long enough to compound. On a small account it is usually the drawdown rule that ends things rather than a missing edge — so each engine is sized against that limit first, and the book is designed to grow by adding accounts rather than adding size. Steady rather than fast. No outcome is guaranteed.

A portfolio, not a bot. Seven edges across three markets, each on its own account, so risk is spread rather than concentrated — although correlations can change and more than one can lose at the same time.
We never touch your account. No login, no credentials, no copier — it runs on your machine and places its own orders.
The whole record is public. Every trade, every losing month, and what each engine is bad at. All of it downloadable.
We trade them ourselves. Same engines, same layout, on our own accounts. Our one prop-firm referral partnership, Boxcar Trading, is disclosed below.
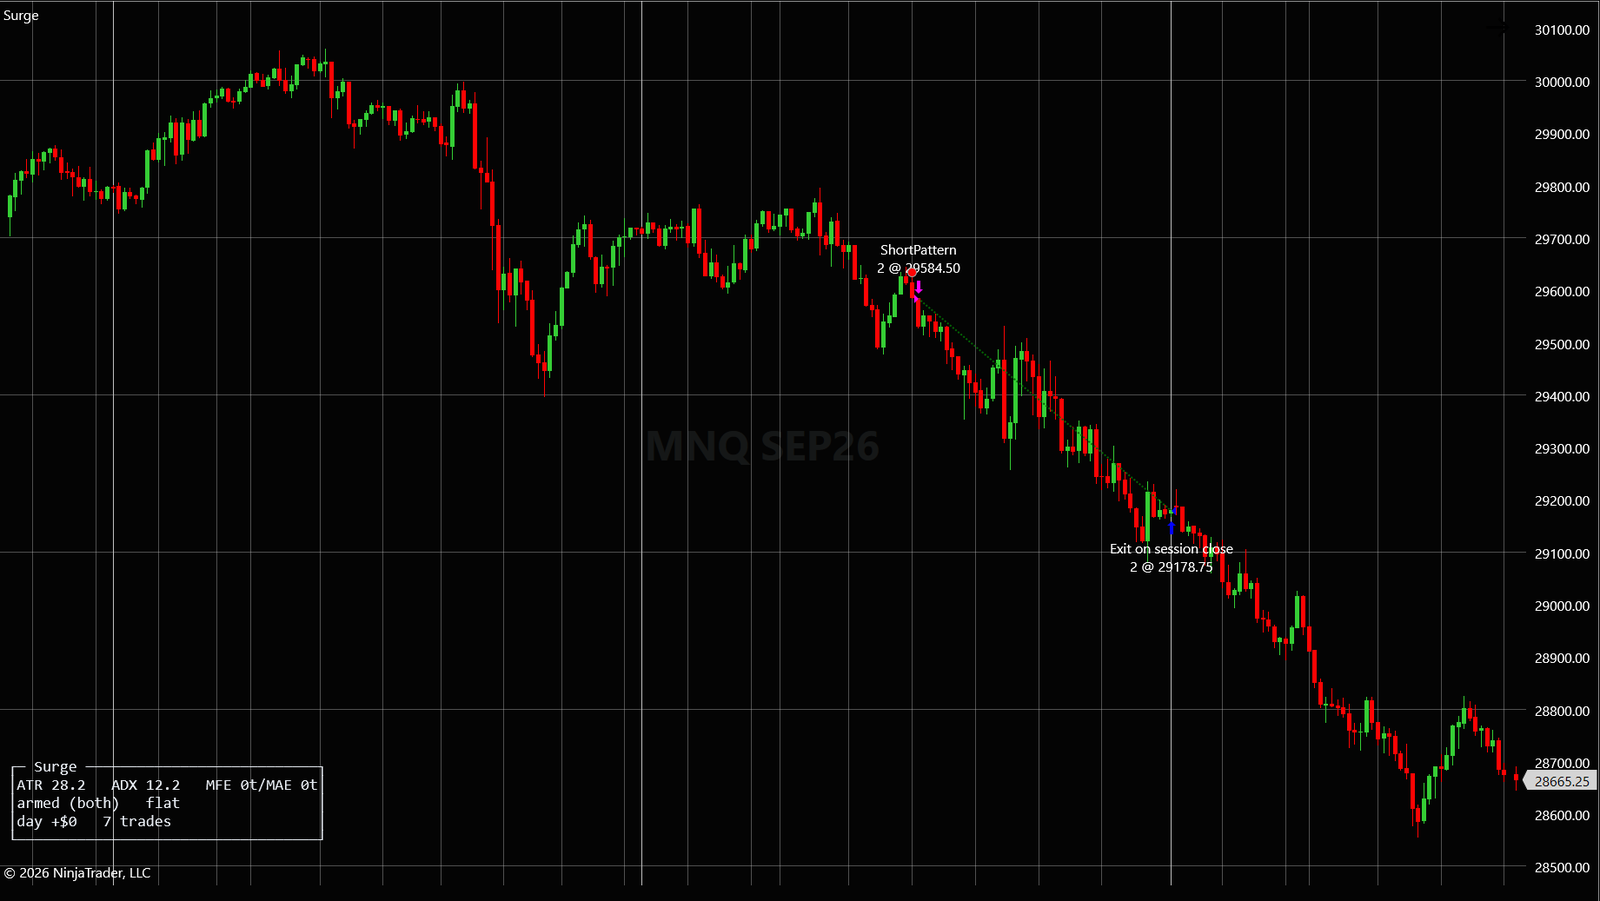
The Surge engine running on a NinjaTrader MNQ 15-minute chart: a short entry and its session-close exit marked on the bars, and a status panel drawn by the strategy reading ATR, ADX, armed, flat, and the day's trade count
What it looks like on your chart — the trade it took, and a panel the strategy draws itself telling you what it is doing right now.
7
Engines in the fleetfour on offer today, three benched — every record stays published
1,113
Backtested trades publishedentry, exit and result for every one
12
Months of published resultsunoptimized — every losing month shown too
32
Days of forward testingrunning unmanaged since September 8, 2026 — 76 trades published so far

Forward test vs. last year

Every engine, against the same calendar days one year earlier

The forward test started September 8, 2026 and runs unmanaged. Each row puts it next to what the same engine did on the same dates in 2025 inside its backtest. Ahead or behind, every engine is shown.

Loading the forward-test record…

Hypothetical results. Forward: simulated prop-evaluation and Sim accounts, actual fills, net of commission, one account per engine. Last year: backtest, same size, same calendar days. Past or simulated performance does not guarantee future results. See every trade in the forward record →

What drives our engines: wide-range days

Our engines earn most of their money on wide-range days, the days when the market travels a long way from its low to its high. We split every backtest day by its range as a percent of price. For most of the engines we tested (8 of 13), the widest 20% of days produced more than half of the year’s profit. For the other five they produced 31–44%, far more than their share of days. The pattern held in the first half of each backtest and again in the second, which is why we trust it.

Where the backtest year’s profit came from Sep 2025 – Aug 2026

EngineWhole yearWidest 20% of days
ApertureMNQ+$9,228+$8,676
IrisMES+$4,999+$1,966
RiftMGC+$4,945+$3,307
CoilMGC+$3,670+$1,506
PathfinderJuniorMES+$5,775+$4,317
RippleMNQ+$3,060+$2,080
SurgeMNQ+$5,781+$3,781
MeridianNQ+$83,910+$86,720
LodestarES+$85,590+$52,491
TectonicGC+$70,877+$30,832
PathfinderES+$58,120+$50,304
CascadeNQ+$57,392+$17,603
TorrentNQ+$76,138+$25,477

Where the widest days exceed the whole year, those days carried the year on their own.

Wide-range days per month top 20% of the year’s days

MonthNasdaqS&P 500Gold
Sep 2025010
Oct 2025446
Nov 2025983
Dec 2025223
Jan 2026324
Feb 2026675
Mar 202671111
Apr 2026152
May 2026205
Jun 20261074
Jul 2026644
Aug 2026215
Sep 2026112

A wide day is a range of at least 1.83% of price in Nasdaq, 1.28% in the S&P 500 and 1.80% in gold. Ranges are measured in each engine’s trading session. September 2026 is the full month.

This is also why September matters to read correctly. In our data, September 2025 had the fewest wide-range days of the year in all three markets, and September 2026 has been calm as well. Our engines are built to be patient through calm weeks and to be in position when a wide day comes. September 21, 2026 was that day in Nasdaq, and it produced the forward test’s largest trade: Aperture and Meridian, the same signal on two contract sizes. The months that followed last year’s calm September, October and November 2025, had many more wide days, and most of our engines’ results rose with them.

Hypothetical results. Backtests are hypothetical, net of commission. A day’s range is only known once the day is over, so this explains when the engines earned. It is not a signal anyone can trade in advance. Past or simulated performance does not guarantee future results.

Our prop firm partner

Boxcar Trading

Eval and Straight-to-Funded futures accounts, with a free Chicago trading VPS included. Launching live on October 1, 2026. Use code ORTHANT at checkout.

Visit Boxcar Trading Code ORTHANT

We earn a commission if you purchase through our Boxcar Trading link or code. Check any firm’s rules before you start.

Why this exists

You have probably bought one of these before
and it did not end well.

I bought dozens before I built these — alert rooms, copiers, black boxes. Here is what kept going wrong, and what we do about each one. Every answer is something you can check for yourself on this site.

The problemMost automated strategies simply don’t deliver

They test beautifully and then trade nothing like the test. You find out with your own money, months in.

What we doWe show you everything we have and let you decide

Nobody can guarantee or foresee future performance, and we don’t pretend to. What we can do is put the whole record in front of you — 1,113 backtested trades across seven engines, entry, exit and result for every one, all of it downloadable, so the judgment is yours to make on the evidence rather than on our say-so.

The problemThe drawdown blows up a small account

Even when a strategy earns, the dip on the way there is bigger than a $50K evaluation can survive. The account dies on the rule, not on the edge.

What we doThe drawdown limit is the design constraint

Each engine is built to live inside a $2,000 trailing limit on its own. Across the published window the engines on sale today had worst drawdowns of $806 to $1,357 — and putting one engine per account is what keeps those from landing on the same limit together.

The problemTwo weeks of results, posted as a track record

A vendor shows a fortnight of wins on YouTube. When it stops working they re-optimize quietly and post another fortnight. The record never goes back far enough to include a bad patch.

What we doOne fixed window, unchanged settings, losing months left in

The window was set before anything was run and applied identically to every engine — no parameter sweep, no picking the best run, no trimming an engine’s history to skip its bad patch. When we do re-optimize on schedule, we will say so plainly and republish, and the published record only ever gets longer.

The problemHanding someone your account login

Managed programs and copy services want your credentials so they can trade your account from their VPS. You are trusting a stranger with your account, and if it goes wrong you find out afterwards.

What we doWe never touch your account. Ever.

We never ask for your login, your broker password, or access of any kind, and there is nothing to give us. The strategy is a NinjaScript add-on that runs on your NinjaTrader®, on your machine or your own VPS, and places its own orders there. No copier, no relay, no managed account, no credentials.

The problemA catchy name and no results behind it

Impressive branding, a slick page, and nothing you can actually inspect. You are asked to buy the story.

What we doEvery engine has a record you can audit

Each one publishes its own equity curve, monthly table, worst drawdown and complete trade list — plus what it is bad at and the conditions where it struggles. Open any engine and check it against a date you remember.

What we are aiming at is not a fast number. It is a system that repeats, keeps the account alive, and grows steadily — with the up and down weeks that any real system has. That is the whole proposition, and every claim above has a page behind it.

Start 30 days free on sim See every trade first → No card to start. Cancel in one click.

Not another collection of trading bots

Most automated trading products are sold one strategy at a time.
We take a different approach.

Our strategies are researched, engineered, tested and deployed as components of a broader automated trading system. Each strategy has a defined role. Together, they form a portfolio designed to diversify trading behavior across market conditions and reduce dependence on any single strategy.

You don’t choose which algorithm to buy.
You get access to the complete system.

Why we built this

Every trader wants three things at once. You get two.

You want it big, you want to survive, and you want it soon. Reach for all three and you reach for leverage — and leverage is the run that ends accounts. So we give one up on purpose.

FAST want it soon BIG net profit SURVIVES account stays alive all three → leverage → blow‑up The sprinter · hero bets fast + big — a run ends it Scalp tiny / sit in cash fast + safe — barely earns Orthant — the marathoner big & surviving, mile after mile
The trader’s trilemma: big, surviving, fast — pick two. The middle, where you have all three, only exists on borrowed size, and borrowed size is what breaches the limit. We chose big and surviving and gave up fast. Slow is the price of still being here.
loss limit One account. One bet. tall & narrow — one run topples it vs each account’s own limit Σ net — the sum across accounts One engine per account. wide & low — nothing reaches the floor
Scale wide, not tall. Every trader wants it big and fast — but fast means leverage, and leverage is the run that ends accounts. We can’t sell fast. We do big slowly, by widening: each account carries one engine and only its own bounded drawdown, and the profit is the sum. The marathoner is the one still trading — the sprinter is not. A 50% drawdown needs +100% just to recover; 70% needs +233%. And five “separate” bets on the same market behave like one big position — which is why every engine is uncorrelated and sits in its own account.

How this works

01

One strategy, one account

Never stacked, never two engines fighting over the same drawdown limit. If one has a bad week, it has it alone.

02

You set the risk, in dollars

Risk per trade is the dial you turn, sized to the account you are actually trading — an evaluation, a funded account, or your own money.

03

They respond differently

Different edges across different markets — breakout, momentum, reversion. Different strategy types may respond differently to changing market conditions.

04

Nothing is hidden

Every trade, every losing month, every drawdown — published in full, so you can decide with all of it in front of you.

The objection we get first

"Doesn't running several strategies in one account reduce the drawdown?"

Partly yes — and we are going to concede that before we argue with it, because the honest version of this is more useful to you than the convenient one. None of what follows is about whose strategies they are. Ours, someone else's, or three you wrote yourself: it is arithmetic about a sum, not a claim about quality.

Where the received wisdom is right. If you hold your total risk fixed and split it across several uncorrelated strategies, the protection is real and large. What ends an account under a trailing limit is the range of the equity path — the fall from a running high to the next trough — and that range scales with the square root of variance. Split one risk budget into four independent streams and you cut the variance while keeping the expected return.

So if someone tells you that splitting a fixed risk budget across several uncorrelated strategies lowers drawdown, they are not making it up. Held that way, on paper, the effect is large and well established.

Now the two reasons you will not get that arrangement. You cannot actually split the risk — on a small account the contract is the floor, so every strategy you add puts its full size on the account whether you meant it to or not. And the correlation you assumed is not the correlation you get: strategies on related instruments drift together under stress, which is exactly the day the limit gets tested.

What it looks like on our own engines

Across the published year each engine on sale today had its own worst drawdown, between $806 and $1,357. Kept on separate accounts, each of those stays inside its own limit. Put several on one account, at the size they actually trade, and they land on the same limit together — nothing has been re-sized to make room. That is the version of “diversification” most people end up running.

So we did not throw diversification away. We moved it. It belongs across accounts, where each strategy gets its own allowance, its own limit, and its bad hour cannot reach the others — and where adding one does not silently enlarge the position the others have to share. One strategy per account is not us being naive about portfolio theory. It is what portfolio theory gives you once the constraint is a hard floor you cannot fall through and a contract size you cannot subdivide.

The full argument, with the simulations and the methodology →  ·  Why sizing matters more than strategy count →  ·  How a trailing threshold ratchets against you →

You have probably tried this the other way

Not another signal service.

I spent three years buying these. Alert rooms, copiers, black-box bots. In live trading — evaluations and funded accounts alike — the results simply were not there. If any of it had worked I would still be using it, and I would never have built these. Here is what kept going wrong, and what I did about it.

Following someone else's signal

By the time an alert reaches your screen — or a copier mirrors somebody else's fill — the move has already happened. You pay the difference in slippage, on every trade, forever.

What happens here

Nothing is relayed. The strategy runs on your own NinjaTrader®, on your machine or your VPS, and takes its own entry the moment its rule is met. There is no middleman between the setup and your order.

The losses you were never shown

Winning screenshots get posted. Losing months quietly do not. Your drawdown counts both, which is how people end up funding an account against a track record that was only ever half published.

What happens here

Every trade of every backtest is published — entry, exit and result — and each strategy's losing months sit on the page beside its good ones. So does the worst drawdown it ever had.

Win rates that are manufactured

Plenty of automated systems produce a beautiful win rate by adding to losing positions until the market comes back. It works until the once that it doesn't — and one of those takes the whole account, which is precisely what a trailing drawdown cannot absorb.

What happens here

One position at a time. It never adds to a loser, never averages down, and never widens a stop. The protective order rests in the market from the moment you are filled — not a mental stop, not one placed afterwards.

Backtests that die on contact with a real account

A strategy tester will happily fill you at prices you would never have got. Fire the entry at the close of a bar, assume the stop was always sitting there, and the curve looks wonderful — right up until real orders go to a real broker and the same strategy trades nothing like its own backtest.

What happens here

Entries and protective orders are worked on a fine execution series instead of being assumed at bar close. This methodology is intended to more closely approximate live execution; actual fills may differ materially. And every trade of every backtest is published, so you can check any of it against a date you remember.

I run these on my own funded accounts at Apex, Bulenox, Lucid and PropShop Trader. They should run at any firm that permits automated NinjaScript strategies — but every firm sets its own rules and changes them, so check yours before you start. We have one referral partnership, with Boxcar Trading, and we earn a commission on purchases made with our code (details). We receive nothing from any other prop firm, and no firm pays us to recommend it.

Who is on the other side of this

I blew up about fifty prop accounts
before I learned anything.

I'm an electrical engineer with a graduate degree in computer science. Bell Labs, then senior leadership running product development at global tech companies, then retirement, travel, boredom — and a search for the thing I'd always actually liked: problems and puzzles. So I started trading, and made an assumption I'm still slightly embarrassed by: options are just maths, and maths is my home turf, so how hard can this be.

Hard, it turns out. I lost a great deal of money. Then I did the sensible-sounding thing and subscribed to the people with the track records and the testimonials, and every one of them put me in a deeper hole than I was in before. Then I moved to futures and found the real problem, and it wasn't the market:

I was so afraid of losing that I took every small profit the moment it appeared, and let every loser run to the bitter end. I knew it was wrong while I was doing it. I did it anyway.

You cannot fix that by trying harder, so I automated it — badly at first. I swung for the fences the way I'd been taught and blew up account after account. Somewhere around fifty of them. What changed was going back to what I actually know how to do: be structured, find the root cause, and stop optimizing for profit — because profit was never what was ending my accounts. Drawdown was.

Read the whole thing — including why I'm selling this at all, and the answer that isn't the flattering one →

Proof before hype

One published scoreboard. Not screenshots.

Every number below is a real NinjaTrader® 1-year backtest of the live strategies — net of commissions and 1-tick slippage, every trade viewable.

Every engine · 1-year backtest · one account each
—
Combined net profit across all strategies, each run on its own account
Per-account drawdown—the range each separate account faces — never a combined figure
Profit factor—gross win ÷ gross loss
Win rate—across — trades
Per month—average, model sizing

That total is the sum of every engine run on its own account — the only way we recommend running them, and the way we run them ourselves. Each account carries one engine and only that engine's drawdown. See Design principle and Scale.

What these numbers already cost you

Backtests die on fill assumptions, so here is the arithmetic in full rather than a footnote. Every figure published on this site is after both of these.

—Gross trading result
—Commission, charged by the platform
—Slippage — one full tick on every contract, every trade
—Net, and the number we publish

—

The numbers that actually end accounts

A drawdown limit isn't breached by a bad average — it's breached by a bad run. So these get the same billing as the profit.

HYPOTHETICAL PERFORMANCE — NO ACTUAL TRADING

HYPOTHETICAL PERFORMANCE RESULTS HAVE MANY INHERENT LIMITATIONS, SOME OF WHICH ARE DESCRIBED BELOW. NO REPRESENTATION IS BEING MADE THAT ANY ACCOUNT WILL OR IS LIKELY TO ACHIEVE PROFITS OR LOSSES SIMILAR TO THOSE SHOWN; IN FACT, THERE ARE FREQUENTLY SHARP DIFFERENCES BETWEEN HYPOTHETICAL PERFORMANCE RESULTS AND THE ACTUAL RESULTS SUBSEQUENTLY ACHIEVED BY ANY PARTICULAR TRADING PROGRAM. ONE OF THE LIMITATIONS OF HYPOTHETICAL PERFORMANCE RESULTS IS THAT THEY ARE GENERALLY PREPARED WITH THE BENEFIT OF HINDSIGHT. IN ADDITION, HYPOTHETICAL TRADING DOES NOT INVOLVE FINANCIAL RISK, AND NO HYPOTHETICAL TRADING RECORD CAN COMPLETELY ACCOUNT FOR THE IMPACT OF FINANCIAL RISK OF ACTUAL TRADING. FOR EXAMPLE, THE ABILITY TO WITHSTAND LOSSES OR TO ADHERE TO A PARTICULAR TRADING PROGRAM IN SPITE OF TRADING LOSSES ARE MATERIAL POINTS WHICH CAN ALSO ADVERSELY AFFECT ACTUAL TRADING RESULTS. THERE ARE NUMEROUS OTHER FACTORS RELATED TO THE MARKETS IN GENERAL OR TO THE IMPLEMENTATION OF ANY SPECIFIC TRADING PROGRAM WHICH CANNOT BE FULLY ACCOUNTED FOR IN THE PREPARATION OF HYPOTHETICAL PERFORMANCE RESULTS AND ALL WHICH CAN ADVERSELY AFFECT TRADING RESULTS.

Assumptions: one contract per account; profits withdrawn, not reinvested; costs are applied inside the backtest by the NinjaTrader® Strategy Analyzer and are already reflected in every figure shown — commission as charged by the platform, and one full tick of slippage on every contract on every trade; entry and exit prices are determined by resting orders worked on a 1-minute execution series. Tick Replay: Iris is backtested with NinjaTrader® Tick Replay enabled, so entries and exits are evaluated tick by tick inside each bar instead of at bar boundaries — the most precise fill simulation the platform offers. Trading futures involves substantial risk of loss.

Open the full backtest explorer → Equity curve · monthly P&L · every single trade — for all strategies.
One continuous 12 months. Zero optimization.

The exact same settings ran straight through the whole year — no parameter tuning, no curve-fitting, no cherry-picked window. Every scheduled shock and a live geopolitical one are already baked into these numbers.

FOMC decisions Non-Farm Payrolls CPI releases PPI releases The Iran conflict

Using unchanged parameters across the full test period helps reduce the risk of overfitting to individual market events.

Backtested using 1-minute execution data and resting-order assumptions intended to more closely approximate live execution. Actual fills may differ.

Most vendors backtest on the same slow bar their signal fires on, which lets the simulator fill at prices that never really traded. We do the opposite: every entry and every protective stop is a resting order worked on a 1-minute execution series — an assumption intended to more closely approximate live execution.

1-minute execution series Resting limit & stop orders Protective stop rests from entry No intrabar fill guessing

The execution methodology is intended to make the backtest more representative of potential live execution, although actual live results and fills may differ materially.

What the backtest produced

One engine. One account.
Then you add accounts.

Every figure below is one contract on one account*, over the published window. That is deliberately the smallest unit we can show you — it is the honest building block, and it is what you should judge us on. The way the number grows is not a better engine; it is the same engines running on more accounts, each one inside its own drawdown limit.

* Ripple and Surge are sized at two contracts; Aperture, Rift and Coil at one. The figures are exactly as each engine was tested and is shipped — per-contract numbers are in the sizing table.

Every month of the backtest, exactly as it came out.

All of it is backtested — the current month included. No month pays the average shown above; this is the same money broken out month by month, red where it lost, with every losing month left in. The last column is a part-month, because the backtests end mid-month rather than at a month boundary. Read the bottom row: that is what the whole set did in each individual month.

About the total row. Each engine is measured over its own history, and those histories are not the same length — so the per-year figures cannot simply be added. The total is built from the per-month column, which is already each engine's net divided by its own months, then annualised. It assumes every engine running at the same time, one contract each*, on its own account. That is one account per engine — an evaluation to pass and a subscription to a prop firm, not one. Each carries its own drawdown limit, and the relevant risk is the worst single account, not the combined curve.

One contract per account, over the published window, net of commission and a full tick of slippage on every trade — both charged inside the backtest, not added on afterwards. Past results are backtested and do not guarantee future performance.

HYPOTHETICAL PERFORMANCE — NO ACTUAL TRADING

HYPOTHETICAL PERFORMANCE RESULTS HAVE MANY INHERENT LIMITATIONS, SOME OF WHICH ARE DESCRIBED BELOW. NO REPRESENTATION IS BEING MADE THAT ANY ACCOUNT WILL OR IS LIKELY TO ACHIEVE PROFITS OR LOSSES SIMILAR TO THOSE SHOWN; IN FACT, THERE ARE FREQUENTLY SHARP DIFFERENCES BETWEEN HYPOTHETICAL PERFORMANCE RESULTS AND THE ACTUAL RESULTS SUBSEQUENTLY ACHIEVED BY ANY PARTICULAR TRADING PROGRAM. ONE OF THE LIMITATIONS OF HYPOTHETICAL PERFORMANCE RESULTS IS THAT THEY ARE GENERALLY PREPARED WITH THE BENEFIT OF HINDSIGHT. IN ADDITION, HYPOTHETICAL TRADING DOES NOT INVOLVE FINANCIAL RISK, AND NO HYPOTHETICAL TRADING RECORD CAN COMPLETELY ACCOUNT FOR THE IMPACT OF FINANCIAL RISK OF ACTUAL TRADING. FOR EXAMPLE, THE ABILITY TO WITHSTAND LOSSES OR TO ADHERE TO A PARTICULAR TRADING PROGRAM IN SPITE OF TRADING LOSSES ARE MATERIAL POINTS WHICH CAN ALSO ADVERSELY AFFECT ACTUAL TRADING RESULTS. THERE ARE NUMEROUS OTHER FACTORS RELATED TO THE MARKETS IN GENERAL OR TO THE IMPLEMENTATION OF ANY SPECIFIC TRADING PROGRAM WHICH CANNOT BE FULLY ACCOUNTED FOR IN THE PREPARATION OF HYPOTHETICAL PERFORMANCE RESULTS AND ALL WHICH CAN ADVERSELY AFFECT TRADING RESULTS.

Assumptions: one contract per account; profits withdrawn, not reinvested; costs are applied inside the backtest by the NinjaTrader® Strategy Analyzer and are already reflected in every figure shown — commission as charged by the platform, and one full tick of slippage on every contract on every trade; entry and exit prices are determined by resting orders worked on a 1-minute execution series. Tick Replay: Iris is backtested with NinjaTrader® Tick Replay enabled, so entries and exits are evaluated tick by tick inside each bar instead of at bar boundaries — the most precise fill simulation the platform offers. Trading futures involves substantial risk of loss.

The number everybody shows you

Anyone can quote a big number.
Here is what it costs.

Big annual figures circulate constantly in this industry, and most of them are real. What is almost never shown is the drawdown that had to be accepted to produce them. So pick a target and we will work it backwards against our own engines — honestly, including the route that does not survive.

HYPOTHETICAL PERFORMANCE — NO ACTUAL TRADING

HYPOTHETICAL PERFORMANCE RESULTS HAVE MANY INHERENT LIMITATIONS, SOME OF WHICH ARE DESCRIBED BELOW. NO REPRESENTATION IS BEING MADE THAT ANY ACCOUNT WILL OR IS LIKELY TO ACHIEVE PROFITS OR LOSSES SIMILAR TO THOSE SHOWN; IN FACT, THERE ARE FREQUENTLY SHARP DIFFERENCES BETWEEN HYPOTHETICAL PERFORMANCE RESULTS AND THE ACTUAL RESULTS SUBSEQUENTLY ACHIEVED BY ANY PARTICULAR TRADING PROGRAM. ONE OF THE LIMITATIONS OF HYPOTHETICAL PERFORMANCE RESULTS IS THAT THEY ARE GENERALLY PREPARED WITH THE BENEFIT OF HINDSIGHT. IN ADDITION, HYPOTHETICAL TRADING DOES NOT INVOLVE FINANCIAL RISK, AND NO HYPOTHETICAL TRADING RECORD CAN COMPLETELY ACCOUNT FOR THE IMPACT OF FINANCIAL RISK OF ACTUAL TRADING. FOR EXAMPLE, THE ABILITY TO WITHSTAND LOSSES OR TO ADHERE TO A PARTICULAR TRADING PROGRAM IN SPITE OF TRADING LOSSES ARE MATERIAL POINTS WHICH CAN ALSO ADVERSELY AFFECT ACTUAL TRADING RESULTS. THERE ARE NUMEROUS OTHER FACTORS RELATED TO THE MARKETS IN GENERAL OR TO THE IMPLEMENTATION OF ANY SPECIFIC TRADING PROGRAM WHICH CANNOT BE FULLY ACCOUNTED FOR IN THE PREPARATION OF HYPOTHETICAL PERFORMANCE RESULTS AND ALL WHICH CAN ADVERSELY AFFECT TRADING RESULTS.

Assumptions: one contract per account; profits withdrawn, not reinvested; costs are applied inside the backtest by the NinjaTrader® Strategy Analyzer and are already reflected in every figure shown — commission as charged by the platform, and one full tick of slippage on every contract on every trade; entry and exit prices are determined by resting orders worked on a 1-minute execution series. Tick Replay: Iris is backtested with NinjaTrader® Tick Replay enabled, so entries and exits are evaluated tick by tick inside each bar instead of at bar boundaries — the most precise fill simulation the platform offers. Trading futures involves substantial risk of loss.

A requirement, not a suggestion

One equity engine and one gold engine.
Per firm. Maximum.

This is the single hardest rule we ask you to follow, and it is the one that decides whether this works for you. It is not about profit. It is about not getting your accounts closed.

First, what a prop firm actually is. You pay a fee, you prove you can trade to their standard, and then they let you trade their money and keep a share of what you make. The money is not yours and the account is not yours. You are trading under their rules.

One of those rules is about hedging. Hedging means being long and short the same thing at the same time — buying gold in one account while selling gold in another. It cancels out. To a prop firm it looks like someone gaming the evaluation rather than trading, and almost every firm bans it. The penalty is not a warning. It is usually closure of the accounts and forfeiture of the profits, and the firms check for it across every account you own with them, because they are all registered to you.

Nobody sets out to hedge. It happens on its own.

Our engines make their own decisions independently. Not one of them knows the others exist. So if you run two engines that trade gold in two accounts at the same firm, sooner or later one decides to buy while the other decides to sell — not because anything is broken, but because that is what independent strategies do. You would not be doing anything wrong, and you would still be in breach.

We can tell you exactly how often, because we measured it on the published backtests below.

Times two of our engines held opposite positions in the same market at the same moment — over the published window

The requirement
  • Never more than one equity-index engine per firm. Our MNQ engines all trade the US stock indices. They move together, so firms treat them as the same exposure.
  • Never more than one gold engine per firm. Both of our gold engines trade the same contract. Two of them at one firm is the clearest breach on this page.
  • An equity engine and a gold engine together is fine. They are different markets and they cannot cancel each other out. Prop-firm rules regarding hedging, correlated positions, automated trading and multiple accounts vary and may change. That is your two accounts per firm — and it is the ceiling.
  • To run a third engine, you open an account at a different firm. Not another account at the same one. This is the whole reason we ask you to spread across firms.

So what can you actually run?

Every layout below is compliant — no firm sees two engines that could ever oppose each other. Each engine is sized to fit inside its own $2,000 drawdown limit.

What this is, and what it is not

We are not selling you
a holy grail.

There isn't one. Anyone who tells you otherwise is either selling something or has not run it long enough to find out. What we build is narrower and far more boring than that, and we would rather you ran the boring version knowingly.

What we are not offering
  • A system that wins every month. Ours don't — the monthly grid above shows every losing month we have had, in red, on purpose.
  • A system that wins every quarter. There are flat and negative stretches lasting months.
  • Something you set up once and never look at again. Edges decay. Ours will too.
  • A number you can borrow against. These are backtests. They describe the past.
What we are offering
  • A set of edges with positive expectancy, each one traded at fixed risk inside a drawdown limit it was designed for.
  • Enough of them, on different markets, that risk is spread rather than concentrated — although correlations can change and losses may occur across multiple strategies simultaneously.
  • A long-horizon proposition. Judged over quarters and years, not over a fortnight.
  • Every trade published, so you can check any claim on this page against the data.
01

Nothing here has been optimized. At all.

These are unoptimized backtests. The parameters are the settings the engines already run, and they were not tuned against this data — not for a day, not for a week, not for a month, not for a quarter. No parameter sweep, no walk-forward selection, no picking the best of several runs. We pressed go once on each engine and published what came back.

The window was fixed before any of it was run and applied identically to every engine — one start date, one end date, no shortening an engine's history to skip its bad patch. Where an engine genuinely has less data than the rest, it carries a visible asterisk saying so rather than being quietly trimmed to flatter it.

This is also why these numbers are not spectacular, and we would rather you understood that than wondered. A curve fitted to thirteen months of known data can be made to look like almost anything. This is what the settings produced, not what we could have made them produce. We do intend to re-optimize on a fixed schedule in future — and when we do, we will say so plainly and republish. Nothing on this page has been through it.

02

They trade straight through the news.

There is no news filter in any of these engines. No blackout window around the Fed, no skipping the inflation print, no sitting out payrolls, no excluded sessions. Every rate decision and every surprise number in the window is in the results — and so is every time one of them went against us.

This matters more than it sounds. Quietly removing the worst days is the most common way a backtest gets flattered, and it is invisible unless you are shown the trades. Pick any date you remember being violent, and look it up in the trade list.

03

One engine went quiet for four months. The book did not.

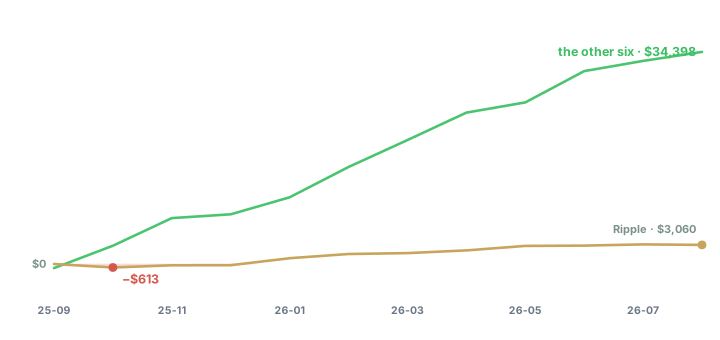
The gold line below is one of our micro Nasdaq engines, month by month, computed from the same trade list you can download. It spent four months below zero, at worst down $613. On its own, that is a stretch that tests anyone’s patience.

The green line is the other engines over the same months. While that engine was under water they made $3,653, and the book was positive in two of those four months.

That is the whole idea. You are not holding one engine and hoping — you are holding several that do not struggle at the same time.

It runs the other way too. When that engine turned and ran through the spring, others were the ones having a poor month. No engine works every month; the book does not need it to. Judge any single engine on its own and you will always find a bad stretch. That is why we do not ask you to run one.

Two cumulative net profit lines by month: one micro Nasdaq engine dips below zero for four months to minus $613 before recovering, while the other four engines rise steadily over the same period
Gold line: the engine. Green: the other four added together. Cumulative net profit month by month, computed from the published trade list. Backtested, one micro contract per engine, costs charged inside the run.

Start here

Do not run every engine
in your first account.

This is the mistake that will cost you an account, and it's the easiest one to make: subscribe, download everything, switch it all on, get punched in the face in week two. So before anything else, here is the order we'd actually put them on — the same order we did, and the reason for each step.

The one thing to avoid

Several engines on one account is not several times the return — it's one account carrying every drawdown at once. Across the published year each on-sale engine's own worst drawdown ran between $806 and $1,357. On separate accounts each of those stays its own problem, inside its own limit. Stacked into one account they land on the same $2,000 limit together. Same strategies, same year — the stacking is the risk.

  1. Step 1

    One engine. Simulation account. Two to four weeks.

    Pick a single engine and run it on sim, side by side with our published backtest for the same dates. You are not testing whether it makes money — we already published a year of that. You are testing whether your fills match ours, on your data feed, your latency, your broker.

    Why this first: if your fills drift from ours, every number downstream is fiction. This is the only step that verifies the ground you're standing on, and it costs nothing.

    You will not be guessing whether it is on. Every engine draws its own status panel on the chart — armed or flat, the levels it is working for the day, and what it has done so far. If the panel says ARMED and nothing has happened, nothing was supposed to happen.

    Move on when: your sim trades line up with the published trade list — same entries, same days, similar fills. Not before.

  2. Step 2

    Same engine. One real account. Nothing else.

    Now put that one engine on a real account — evaluation, funded, or your own capital, it makes no difference to the trades. Still one engine. Still one account.

    Over the published window a single engine on sale today returned between $3,670 and $9,228 on one contract*, with its own worst drawdown between $806 and $1,357. That is the per-account range, best and worst — roughly $306 to $769 a month depending on which engine you start with.

    Why not add a second yet: you're still testing your execution, not the strategy. Adding a second engine now means that if something goes wrong you won't know which one caused it.

    Move on when: you've traded it for a full month without touching it.

  3. Step 3

    Two accounts. Two engines. Different markets.

    Add a second engine — on a separate account, trading a different instrument family. One equity-index engine and one gold engine. Never two of the same family, and ideally not at the same firm.

    One equity-index engine and one gold engine, a year, one contract each*, ran between $8,670 and $14,173 combined depending on the pair — and because the accounts are separate, the worst any single account faced was still just its own drawdown.

    Why this is the real step up: this is the first point at which you own two bets instead of one. Two engines on the same account would have been one bet with double the risk.

  4. Step 4

    Scale out, never up.

    To go further you add accounts, not contracts. Doubling an engine to two lots doubles its drawdown too — Rift at 2 lots is −$2,930, straight through a $2,000 limit. The limit doesn't grow just because you did.

    All four engines on offer together ran about $22,800 over the published window, each at its tested size. Five of them trade the equity-index complex and two trade gold, so holding all seven without two of the same family landing at one firm takes five firms. That's the destination, not the starting line.

    How the money actually scales

    Three accounts running one contract each* is not the same thing as one account running three. The first multiplies the income while every account keeps its own separate limit; the second multiplies the income and the risk in one place. So we grow sideways.

    Same engine, one contract each*, on separate accounts. This is how the book is actually run — and it is why the ceiling is the number of accounts you can fund, not the size you dare trade.

    Why a firm per engine: see The Portfolio. Five of the seven trade the equity-index complex, and firms treat that whole complex as one family — so the layout, not our preference, decides the firm count.

The honest ladder
$50K accountEngine you addFamilyPlaced at Firms so farRunning 12-month netWorst DD in any one account
Loading…

HYPOTHETICAL PERFORMANCE — NO ACTUAL TRADING

HYPOTHETICAL PERFORMANCE RESULTS HAVE MANY INHERENT LIMITATIONS, SOME OF WHICH ARE DESCRIBED BELOW. NO REPRESENTATION IS BEING MADE THAT ANY ACCOUNT WILL OR IS LIKELY TO ACHIEVE PROFITS OR LOSSES SIMILAR TO THOSE SHOWN; IN FACT, THERE ARE FREQUENTLY SHARP DIFFERENCES BETWEEN HYPOTHETICAL PERFORMANCE RESULTS AND THE ACTUAL RESULTS SUBSEQUENTLY ACHIEVED BY ANY PARTICULAR TRADING PROGRAM. ONE OF THE LIMITATIONS OF HYPOTHETICAL PERFORMANCE RESULTS IS THAT THEY ARE GENERALLY PREPARED WITH THE BENEFIT OF HINDSIGHT. IN ADDITION, HYPOTHETICAL TRADING DOES NOT INVOLVE FINANCIAL RISK, AND NO HYPOTHETICAL TRADING RECORD CAN COMPLETELY ACCOUNT FOR THE IMPACT OF FINANCIAL RISK OF ACTUAL TRADING. FOR EXAMPLE, THE ABILITY TO WITHSTAND LOSSES OR TO ADHERE TO A PARTICULAR TRADING PROGRAM IN SPITE OF TRADING LOSSES ARE MATERIAL POINTS WHICH CAN ALSO ADVERSELY AFFECT ACTUAL TRADING RESULTS. THERE ARE NUMEROUS OTHER FACTORS RELATED TO THE MARKETS IN GENERAL OR TO THE IMPLEMENTATION OF ANY SPECIFIC TRADING PROGRAM WHICH CANNOT BE FULLY ACCOUNTED FOR IN THE PREPARATION OF HYPOTHETICAL PERFORMANCE RESULTS AND ALL WHICH CAN ADVERSELY AFFECT TRADING RESULTS.

Assumptions: one contract per account; profits withdrawn, not reinvested; costs are applied inside the backtest by the NinjaTrader® Strategy Analyzer and are already reflected in every figure shown — commission as charged by the platform, and one full tick of slippage on every contract on every trade; entry and exit prices are determined by resting orders worked on a 1-minute execution series. Tick Replay: Iris is backtested with NinjaTrader® Tick Replay enabled, so entries and exits are evaluated tick by tick inside each bar instead of at bar boundaries — the most precise fill simulation the platform offers. Trading futures involves substantial risk of loss.

Each row adds one engine on its own account — the running net is cumulative, the drawdown column is the worst any single account faced, never a combined curve. Engines are added safest-first, and each goes to the lowest-numbered firm not already holding its instrument family, which is why the firm count climbs the way it does. One contract per engine throughout. These are trading results, not take-home: on an evaluation the profit is notional, on a funded account you keep your split, on your own capital you keep all of it and post the margin yourself. Drawdown is per account — there is no combined curve because the accounts never share one.

Model your own accounts

Tell it what you have.
It will tell you what's most likely.

Most allocation advice in this space is "buy more accounts." This does the arithmetic instead — including the part nobody shows you, which is how many genuinely independent bets you end up with once you run out of distinct engines.

HYPOTHETICAL PERFORMANCE — NO ACTUAL TRADING

HYPOTHETICAL PERFORMANCE RESULTS HAVE MANY INHERENT LIMITATIONS, SOME OF WHICH ARE DESCRIBED BELOW. NO REPRESENTATION IS BEING MADE THAT ANY ACCOUNT WILL OR IS LIKELY TO ACHIEVE PROFITS OR LOSSES SIMILAR TO THOSE SHOWN; IN FACT, THERE ARE FREQUENTLY SHARP DIFFERENCES BETWEEN HYPOTHETICAL PERFORMANCE RESULTS AND THE ACTUAL RESULTS SUBSEQUENTLY ACHIEVED BY ANY PARTICULAR TRADING PROGRAM. ONE OF THE LIMITATIONS OF HYPOTHETICAL PERFORMANCE RESULTS IS THAT THEY ARE GENERALLY PREPARED WITH THE BENEFIT OF HINDSIGHT. IN ADDITION, HYPOTHETICAL TRADING DOES NOT INVOLVE FINANCIAL RISK, AND NO HYPOTHETICAL TRADING RECORD CAN COMPLETELY ACCOUNT FOR THE IMPACT OF FINANCIAL RISK OF ACTUAL TRADING. FOR EXAMPLE, THE ABILITY TO WITHSTAND LOSSES OR TO ADHERE TO A PARTICULAR TRADING PROGRAM IN SPITE OF TRADING LOSSES ARE MATERIAL POINTS WHICH CAN ALSO ADVERSELY AFFECT ACTUAL TRADING RESULTS. THERE ARE NUMEROUS OTHER FACTORS RELATED TO THE MARKETS IN GENERAL OR TO THE IMPLEMENTATION OF ANY SPECIFIC TRADING PROGRAM WHICH CANNOT BE FULLY ACCOUNTED FOR IN THE PREPARATION OF HYPOTHETICAL PERFORMANCE RESULTS AND ALL WHICH CAN ADVERSELY AFFECT TRADING RESULTS.

Assumptions: one contract per account; profits withdrawn, not reinvested; costs are applied inside the backtest by the NinjaTrader® Strategy Analyzer and are already reflected in every figure shown — commission as charged by the platform, and one full tick of slippage on every contract on every trade; entry and exit prices are determined by resting orders worked on a 1-minute execution series. Tick Replay: Iris is backtested with NinjaTrader® Tick Replay enabled, so entries and exits are evaluated tick by tick inside each bar instead of at bar boundaries — the most precise fill simulation the platform offers. Trading futures involves substantial risk of loss.

The portfolio

Named systems, real results, drawdown-first.

Different edges — and, just as important, different weaknesses. Each is a distinct, rules-based system, and each card opens to a plain-language write-up of what you're trading, why it works, and what it is bad at.

How all of them run
  • A live status panel on the chart. Every engine draws a fixed HUD — what it's doing right now, whether it's in a position, and where it stands on the day. You never have to guess whether it's working.
  • You can see your protective orders. Stops and targets are genuine resting orders in the market from the moment you're filled — not mental stops, not stops placed later. Because they're real working orders, NinjaTrader displays them on the chart like any order you'd place yourself.
  • Chart or Control Center. Each strategy loads its own data internally, so it runs identically enabled on a chart or from NinjaTrader's Control Center. Control Center is the hands-off option if you don't want a chart open per instrument — the one trade-off is that the HUD only appears where there's a chart.
  • Copier-friendly. These place ordinary NinjaTrader orders on a single account, so any trade copier will mirror them to your other accounts.
  • One position at a time. Nothing here pyramids into a winner, adds to a loser, or averages down. How many contracts that position is varies by engine — some trade a single contract, some size from the risk you set — and each write-up says which.
  • Flat overnight. Every engine closes its positions and holds nothing into the next day.
Notice the pattern. Aperture and Iris thrive in trend; Rift and Coil thrive in chop. Their weak spots don't overlap — which is exactly why running them together is smoother than any one alone. The weaknesses are the point.

Backtested results are historical simulations and may not reflect actual execution, slippage beyond that modeled, data issues, or prop-rule changes.

Design principle

One strategy per account.
We will talk you out of adding more.

Every vendor in this space sells you a suite — four, five, six strategies, usually all on the same instrument, marketed as diversification. Run that inside a prop account and you will find out what nobody told you: they trade against each other, and the compliance team notices before you do.

01

The drawdown is the only exam

A $50K account fails on one rule: the trailing drawdown. So every strategy has to survive that limit alone — not as part of a blended book that looks fine on a combined equity curve you will never actually trade.

Each on-sale engine's own worst drawdown over the published year ran between $806 and $1,357 — inside a $2,000 limit when it is the only thing on the account. Put several on one account, at the size they actually trade, and those figures stack against that same single limit. Same strategies, same year, nothing re-sized.

02

Correlation math stops applying

"Uncorrelated strategies smooth your equity curve" is true — and irrelevant when each one lives in its own account. Two curves only smooth each other if they share a balance. Yours don't.

Which means a strategy has to earn its place on its own numbers. We killed our own favorite argument for keeping one — it was carried by a −0.25 correlation that, under this design, is worth exactly nothing.

03

Hedging rules are firm-wide

Opposing positions in the same or a closely related instrument, held more than a few seconds, can be flagged as hedging — across every account you hold with that firm, not just within one. A mean-reversion strategy short while a continuation strategy is long counts, even in two different accounts, even when the strategies never knew about each other. It's a CME rule, so no firm can grant you an exception to it.

Most firms never check. We ran two gold strategies in overlapping morning windows across four firms for two years — and exactly one of them auto-flagged both accounts. That's the point: you don't get to know in advance which firm is watching, so the layout is built to remove the opportunity rather than rely on it not being noticed.

04

One instrument, one engine, one firm

The rule that falls out of the above: never two strategies on the same instrument at the same firm — however many accounts you spread them across. If two of ours conflict, we tell you which one to run and which to leave off.

That is the opposite of a suite upsell, and it is deliberate. You are after an account that survives, not a shelf of products.

What this costs us: fewer subscriptions per trader. What it's designed to do: reduce the risk that activity in one strategy affects another account. Every claim above is checkable — the trade-by-trade backtests are published in full, including the months that went against us.

Putting it together

The Portfolio
is the grid, not the strategies.

Everyone asks which strategy to run. That's the wrong unit. What you actually own is a grid of accounts across several firms — and that grid is the thing that either survives a bad month or doesn't. Here is exactly how we lay ours out, and why each rule exists.

AccountFirmEngineInstrumentFamilyStandalone max DD
01Firm AApertureMNQEquity index−$806
02Firm ARiftMGCGold−$1,357
03Firm BIrisMESEquity index−$848
04Firm BCoilMGCGold−$972

One engine per account

Keeping one engine per account isolates that strategy's drawdown from the activity of other Orthant strategies. Future drawdowns may exceed historical backtested drawdowns.

One family per firm, per direction

At any single firm we hold at most one equity-index engine and one gold engine. Two positions in the same family can never point opposite ways, because there's only one of them. The hedging problem is solved by layout, not by software that blocks trades.

Five firms, not one

Firms change rules, delay payouts, and occasionally fail. Concentrating every account at one firm makes the firm your single biggest risk — bigger than any drawdown. Spreading them means no single firm decision can end the whole book.

Diversify by edge type, not by count

Breakout, gap-reversal, momentum, reversion, scalp. Several accounts running versions of the same idea is one bet with extra fees. The grid only works if the engines fail at different times.

Check the platform, not the brand

Two firms are only diversified if they don't sit on the same infrastructure. Prop firms have failed before, and when the cause sits at the platform or licensing layer it can take several firms with it at once — leaving balances stuck and accounts frozen. Firm correlation is a platform question, not a brand one.

Stagger the payout ladders

First withdrawals are usually capped and rise with each consecutive payout, so an account's worth grows with its payout history — old accounts are assets. Start them at different times and the ladders desynchronise, which turns lumpy withdrawals into something closer to income.

Why the grid, and not one big account
Counterparty first Experienced traders routinely spread accounts across more than one firm, and the usual reason is not extra capital — it is not wanting every account to depend on a single firm's decisions. Counterparty risk is the thing they price first.
The rule, not the edge A funded account is far more often ended by breaching a loss limit than by an absence of edge. The account dies on a rule — which is why the rule is the thing we design against.
breadth = 1 Copy one signal across twenty accounts and portfolio theory is blunt about it: your number of independent bets is one. You get twenty times the fees, twenty times the correlated ruin, and no diversification whatsoever. A grid only counts if the cells are genuinely different.

That last point is the one the industry quietly skips. Most multi-account advice is about execution — copiers, VPS latency, order routing — and almost none of it is about whether you actually hold more than one bet. We'd rather give you one engine per account than six copies of the same trade.

Notice what the layout costs. Two of the four engines trade the equity-index complex, and a firm treats that complex as one family — so it is one equity engine per firm, and the full set needs two firms. The grid decides how many you can deploy, not the other way round. That is the trade we make on purpose: fewer engines running than we own. The configuration is designed to reduce the potential for opposing positions in the same instrument family at a single firm.

HYPOTHETICAL PERFORMANCE — NO ACTUAL TRADING

HYPOTHETICAL PERFORMANCE RESULTS HAVE MANY INHERENT LIMITATIONS, SOME OF WHICH ARE DESCRIBED BELOW. NO REPRESENTATION IS BEING MADE THAT ANY ACCOUNT WILL OR IS LIKELY TO ACHIEVE PROFITS OR LOSSES SIMILAR TO THOSE SHOWN; IN FACT, THERE ARE FREQUENTLY SHARP DIFFERENCES BETWEEN HYPOTHETICAL PERFORMANCE RESULTS AND THE ACTUAL RESULTS SUBSEQUENTLY ACHIEVED BY ANY PARTICULAR TRADING PROGRAM. ONE OF THE LIMITATIONS OF HYPOTHETICAL PERFORMANCE RESULTS IS THAT THEY ARE GENERALLY PREPARED WITH THE BENEFIT OF HINDSIGHT. IN ADDITION, HYPOTHETICAL TRADING DOES NOT INVOLVE FINANCIAL RISK, AND NO HYPOTHETICAL TRADING RECORD CAN COMPLETELY ACCOUNT FOR THE IMPACT OF FINANCIAL RISK OF ACTUAL TRADING. FOR EXAMPLE, THE ABILITY TO WITHSTAND LOSSES OR TO ADHERE TO A PARTICULAR TRADING PROGRAM IN SPITE OF TRADING LOSSES ARE MATERIAL POINTS WHICH CAN ALSO ADVERSELY AFFECT ACTUAL TRADING RESULTS. THERE ARE NUMEROUS OTHER FACTORS RELATED TO THE MARKETS IN GENERAL OR TO THE IMPLEMENTATION OF ANY SPECIFIC TRADING PROGRAM WHICH CANNOT BE FULLY ACCOUNTED FOR IN THE PREPARATION OF HYPOTHETICAL PERFORMANCE RESULTS AND ALL WHICH CAN ADVERSELY AFFECT TRADING RESULTS.

Assumptions: one contract per account; profits withdrawn, not reinvested; costs are applied inside the backtest by the NinjaTrader® Strategy Analyzer and are already reflected in every figure shown — commission as charged by the platform, and one full tick of slippage on every contract on every trade; entry and exit prices are determined by resting orders worked on a 1-minute execution series. Tick Replay: Iris is backtested with NinjaTrader® Tick Replay enabled, so entries and exits are evaluated tick by tick inside each bar instead of at bar boundaries — the most precise fill simulation the platform offers. Trading futures involves substantial risk of loss.

Every drawdown above is the standalone figure from the published 1-year backtests — what one account actually experiences, not a blended curve. All six sit inside a $2,000 trailing limit. Firms are anonymised here; the layout is the one we run.

Think about this yourself

Two things nobody tells you
about running multiple accounts.

We went looking for how serious traders construct a multi-firm book and found almost nothing — the published material is either firm marketing, copier and VPS vendors, or affiliate comparison pages. There is an execution-ops literature. There is no portfolio-construction literature. These two points came out of that search. Take them and use them, whoever you end up subscribing to.

01

Ten accounts can still be one bet

Your information ratio scales with the square root of breadth — and breadth counts independent decisions, not accounts, not contracts, not firms. Copy one signal to ten accounts and your breadth is one: ten times the fees, and every account fails on the same day.

Ask yourself: if my worst trade of the year happened tomorrow, how many of my accounts would still be alive? If the answer is "none", you own one account with extra paperwork.

02

The drawdown type should pick the strategy

A trailing limit follows your highest-ever balance, so it tightens when you make money and give some back — and it can end an account on a trade that finished profitable. Compatibility with a drawdown regime is therefore a property of the strategy, not of the firm.

Ask yourself: am I choosing firms by profit split and payout speed — or by whether their drawdown rule is compatible with how my strategy actually makes money? Almost everyone does the first. The second is what ends accounts.

The full argument, the sources, and four problems we have not solved →

The complete picture

One engine. One account.

How the pieces stack into a prop-ready system — distinct signal edges at the base, potentially funded payouts at the top. Each layer only works because the one beneath it does.

Potentially funded payoutsa complete, hands-free prop solution
Drawdown-first risk controlevery account independently inside its $2K trailing limit
Isolated allocationone strategy per account — and never two on the same instrument at one firm
Four signal enginesAperture · Iris · Rift · Coil · gold gap reversal at support/resistance, gold low-volatility reversion, nasdaq pre-market range breakout and s&p opening-range breakout

Different edges, different instruments, different market conditions — run separately, so no single account depends on a blended curve and no two positions can be flagged as hedged against each other.

Choosing your first engine

Which one should you start with?

You don't have to run the full model. Pick a leaner combo — or a single engine — and everything recalculates to that choice alone. If you run only one engine, you only carry that engine's drawdown. Your comfort, your call.

Four starting points, not four products. Each one is a single engine, with its own 12-month backtest beside it — what it returned, and the worst drawdown it put an account through. The labels are a way in, not a ranking: read the two numbers, pick the pair you can actually live with, then look at the engine behind it. You can change the mix afterwards, and the full table is on the results page.

Every option is a real 1-year backtest, drawdown shown against a 50K account's $2,000 trailing limit. Prefer to explore freely? The full builder lets you test any combination.

Where it goes, eventually

One account is where you start.
It isn't where you stop.

Everything in Start Here still applies: one engine, one account, and you don't add the second until the first has run a full month without you touching it. This section is what the road looks like after that — not an argument for skipping it. Each account added is a separate engine on a separate limit.

Build it yourself.

Pick which engines go in each account. Add as many accounts as you like. Everything below recalculates from the actual backtested trades — the equity curve and drawdown for each account are computed by merging the trades of the engines you put in that account, because that is what the account would really have experienced. Accounts are then simply added together.

Illustrative example — five accounts, each running a single engine, on backtested results. Per-account figures are hypothetical and independent; combined totals assume identical settings and are not a projection or guarantee of actual results. Each prop firm sets its own drawdown limit and rules.

Before you subscribe

Who this is for,
and who it isn’t.

We would rather you started for the right reason than started at all. Here is the honest fit test.

✓

Who it is for

Someone who wants a rules-based system they don’t have to argue with at 10am, who is content to run it small and unattended for a month before deciding anything, and who judges it over quarters rather than weeks. If that is you, the rest of this page is written for you — every trade behind it is published, and we run the same engines on our own accounts.

✕

You need it to double an account this quarter

Over the published window a single engine ran between $306 and $769 a month on one contract, and the way that number grows here is more accounts, not more size. It compounds steadily rather than quickly.

✕

You would switch it off in a slow week

Any real system has flat and losing stretches; ours are published alongside the good months. An automated strategy you intervene in is discretionary trading with extra steps.

✕

You can’t leave a machine running

This needs a computer or VPS that stays on through the session, with a data feed. If the laptop closes at lunchtime, the strategy can’t manage its own stops.

One more thing, said once: futures trading carries real risk, these results are backtested, and you should fund this with money you can afford to put at risk. That is true of everything in this business — we would just rather say it ourselves.

Pricing

Pay per engine — or take the whole track.

30 days free · on simulation

Your first thirty days are free, and we want you to spend them on a sim account.

Not a crippled demo — every engine, every preset, the full thing. The only thing we ask is that you point it at simulation rather than at an evaluation you have paid for.

What thirty days will tell you
  • That it installs, connects and runs on your machine, with your data feed.
  • That it takes trades you can watch, marks them on the chart, and shows you its state without you digging through the Orders tab.
  • That its fills on your platform line up with the trade lists published here.
  • Whether you can actually live with it running — the pace, the pauses, the days it does nothing at all.
What to judge later, not in month one
  • The edge itself. Thirty days is a handful of trades — on some engines fewer than ten. That is what the published year is for, and it is all downloadable.
  • The pace. These are built to compound steadily across quarters, so a single strong month or a slow one tells you very little either way.

A free month is normally a way of getting you to subscribe quickly. We would rather you used it properly: check the machinery on sim, and judge the money against the published year — which is already in front of you, trade by trade.

No card required to start, and canceling is one click inside your account — you never have to email anyone to leave. We do ask one thing, and it is a request rather than a condition: tell us why you are going. One line is enough. We would rather know that the install was painful, that it traded too rarely, or that you simply did not trust it, than guess. If you decide to go live before the month is out that is your call — though we would rather you had watched it run on sim for a few weeks first.

Micro · built for a $2K drawdown limit
Or any single micro engine
EngineContractWorst backtested drawdownPrice
ApertureMNQ−$806$119/mo
IrisMES−$848$69/mo
RiftMGC−$1,357$59/mo
CoilMGC−$972$49/mo
Every engine bought separately$296/mo
Mini · designed to stay under $20K · any account
Mini package · every mini engine
Save -7%
$3,000/mo $2,797

$-203 a month less than buying every mini engine separately — $-2,436 a year.

Every mini engine on offer, licensed together. Run them on your own account, a large prop account, or both.

Ask about the mini system
Or any single mini engine
EngineContractWorst backtested drawdownPrice
LodestarES−$6,086$999/mo
MeridianNQ−$9,807$999/mo
TectonicGC−$13,256$799/mo
Every engine bought separately$2,797/mo

Monthly. Cancel anytime — the unused days of your billing period are refunded (refund policy). To subscribe to a single engine, tell us which one. Drawdowns are hypothetical backtest figures, each engine on its own account, from the published backtests; they are not a promise of future results.

Just want Aperture and Iris? Follow them on Collective2.

Our two micro index engines also trade in public as Orthant Duo on Collective2, an independent strategy marketplace. Collective2 records every signal as it happens and keeps the track record itself, so you don’t have to take our word for it. Subscribers there can have trades copied to a supported broker through C2’s AutoTrade instead of running NinjaTrader. $150/mo, billed by Collective2.

See Orthant Duo on Collective2 →

Collective2 results are hypothetical, include C2’s estimate of fees and commissions, and are not a promise of future results. On C2, Aperture runs at a fixed 1 MNQ and Iris is sized by its risk per trade, which may differ from how you run them yourself.

How to start

Start each engine on its own SIM account — four engines, four accounts — and let them run for a few weeks before any of them trade money. One engine per account is not a formality, it is the whole idea: it keeps each edge’s drawdown its own problem, and it is the only way to learn what an ordinary bad week looks like for a given engine rather than for the pile.

After that, where they run is your call. They can go on evaluation accounts — I run all of them in my various prop accounts myself. You know your firm’s rules and your own tolerance better than I do, and every trade of every engine is published on this site, so you can decide on the numbers rather than on my opinion.

One thing to know before you pick

Prop firms treat the equity-index complex as one family — so one engine per firm is the practical limit, and more engines means more firms. Size them on that basis.

Annual is ten months — two free.
Founder price is locked for life. If prices rise later, yours does not.

The subscription includes the same software, the same updates and the same support for everyone. Nothing is priced by whether your account is an evaluation, funded, or your own money — that is your business, not a billing tier. Prices are per person and cover every account you run on your own machines. Cancel anytime: the unused days of your billing period are refunded. Our only referral partnership is with Boxcar Trading: we earn a commission on purchases made with our code, and receive nothing from any other prop firm.

How we earn your trust

No performance promises. Proof and a fair deal instead.

We don't — and legally can't — guarantee trading results. Anyone who does is a red flag. What you get instead is total transparency and a low-risk way in.

  • Every trade, published. The model portfolio stays public and updated — you always see the real thing, not screenshots.
  • Cancel anytime. Month-to-month, no lock-in, no contracts — and the unused days of your month are refunded.
  • Software satisfaction. If the automation doesn't install or run as described, we make it right or refund the subscription.
  • We trade it too. The same systems run on our own evaluation and funded accounts.

Start your 30 days on sim

Every copy is licensed — including the trial.

There is no anonymous download here. Each build is issued against a named request and licensed to your NinjaTrader® account, and that applies to the free trial exactly as it applies to a paid subscription. It is the only way we can stand behind what is running under our name.

01

You ask, we issue

Name, email and country. We do not issue licenses into jurisdictions we are not permitted to supply, and we would rather say that plainly than discover it later.

02

A ready-to-run build

You receive the strategy as a compiled NinjaScript add-on, not source code. It imports into NinjaTrader® the same way any other add-on does, and it is ready to run once the license key is in.

03

The matching template, always

The template ships with the build. Nobody hand-keys parameters — that is how a strategy ends up trading something other than what was tested, and it is the single most common way an automated setup goes wrong.

04

Licensed to your NinjaTrader® account

The license is issued against the email on your NinjaTrader® account, and the platform checks it when the strategy starts. There is nothing to install, no key to paste and no file to move — and because it follows the account rather than the hardware, your desktop, your laptop and your VPS all work with no reissue. Thirty days on simulation, then it converts or it stops.

Straight answers

What every serious trader asks first.

Will this pass my evaluation?

Nobody can honestly promise that, and you should be wary of anyone who does. What we can tell you is what these were built against: a $50K evaluation fails on the trailing drawdown, not on the headline account size, so every engine here is designed and sized to live inside that limit on its own. Across the published year each one on sale today had a worst drawdown between $806 and $1,357 against a $2,000 allowance. The trades behind that are all published, so you can check the claim rather than take it.

Do you run these on your own accounts?

Yes — that is the whole basis of this. The same engines run on my own evaluation and funded accounts at several firms, one engine per account, exactly the layout we describe here. We are not selling a system we do not trade.

Why take the package instead of one engine?

You can take one engine — every engine is sold on its own. But one engine is one strategy on one instrument: one bet, and if it stops working that is your problem to discover. The package is the portfolio: engines across the Nasdaq, the S&P and gold, the layout that keeps them from colliding at one firm, and every trade of every engine published so you can audit any of it — for less than the engines cost separately. There are no add-ons and no upsell, and our one prop-firm referral partnership, Boxcar Trading, is disclosed on this page. Engines get reviewed on a schedule and retired when they stop earning their place; that maintenance is part of what you are paying for.

Why is this a subscription instead of a one-time purchase?

Because the work does not stop when the file is written. Every edge decays — ours included — so the engines are re-tested on a schedule, re-optimized when the market moves under them, and retired and replaced when they no longer earn their place. That is continuous research, and the subscription is what pays for it: the years of work behind the current book, and the work that keeps it current. A one-time sale would buy you a file frozen on the day you bought it, and we would have no reason to keep testing it. You are leasing a maintained system, not purchasing a static one.

Is this a profit guarantee?

No — and no one can honestly offer one. Nothing we promise is tied to your results. What we stand behind is the software: if it does not install or run as described we make it right or refund the subscription, and you can cancel in one click. Nobody here promises that you profit or that you pass an evaluation.

What platform and data feed do I need?

NinjaTrader® — it is our featured and recommended platform, the one every engine was built and backtested on, and the strategies are NinjaScript add-ons that run inside it. We use Kinetick® for market data, which offers end-of-day data free for NinjaTrader® users. More on the platform and data →

Why micro contracts?

Because in a 50K prop account the drawdown limit matters more than the headline size. Micros let the strategy breathe without tripping the trailing drawdown.

Will there be losing periods?

Yes — plainly. Every real system has them. The design goal is long-term expectancy under a controlled-risk framework, not daily certainty.

Do you trade these yourself?

Yes. These run on the same funded and evaluation accounts you're considering — that's the whole point.

Disclosures

The required legend, in full.

HYPOTHETICAL PERFORMANCE RESULTS HAVE MANY INHERENT LIMITATIONS, SOME OF WHICH ARE DESCRIBED BELOW. NO REPRESENTATION IS BEING MADE THAT ANY ACCOUNT WILL OR IS LIKELY TO ACHIEVE PROFITS OR LOSSES SIMILAR TO THOSE SHOWN. IN FACT, THERE ARE FREQUENTLY SHARP DIFFERENCES BETWEEN HYPOTHETICAL PERFORMANCE RESULTS AND THE ACTUAL RESULTS SUBSEQUENTLY ACHIEVED BY ANY PARTICULAR TRADING PROGRAM.

One of the limitations of hypothetical performance results is that they are generally prepared with the benefit of hindsight. In addition, hypothetical trading does not involve financial risk, and no hypothetical trading record can completely account for the impact of financial risk in actual trading. For example, the ability to withstand losses or to adhere to a particular trading program in spite of trading losses are material points which can also adversely affect actual trading results. There are numerous other factors related to the markets in general or to the implementation of any specific trading program which cannot be fully accounted for in the preparation of hypothetical performance results and all of which can adversely affect actual trading results.

All performance shown on this website is hypothetical and backtested. Nothing on this site represents actual trading in a live funded account. Futures trading involves substantial risk of loss and is not suitable for every investor. You should carefully consider whether trading is appropriate for you in light of your circumstances, knowledge and financial resources.

This website is provided for educational and informational purposes only. Nothing here is a solicitation, a recommendation to buy or sell any futures contract, or investment advice. We do not manage accounts, accept funds, or trade on behalf of any client.

Prop-firm referral disclosure. Orthant has one referral arrangement with a proprietary trading firm: Boxcar Trading. We earn a commission if you purchase a Boxcar Trading account through our link or with our code ORTHANT. Orthant and Boxcar Trading are independent companies; neither owns, controls or employs the other. We have no affiliate, referral or revenue-sharing arrangement with any other proprietary trading firm, and we receive no payment or benefit of any kind if you open, fund or maintain an account at any other firm. Where this site discusses spreading engines across multiple firms, it does so solely because of the position-conflict rules described in that section. Firm rules, fee structures, drawdown terms and payout policies vary between firms and change over time; you are responsible for reading the agreement of any firm you trade with, and for ensuring your own configuration complies with it. Our sole commercial relationship with you is the strategy subscription.

NinjaTrader® is a registered trademark of NinjaTrader Group, LLC. Kinetick® is a registered trademark of Kinetick, Inc. NinjaScript is a trademark of NinjaTrader Group, LLC. Orthant is an independent third-party vendor and is not affiliated with, endorsed by, or sponsored by NinjaTrader Group, LLC. All other trademarks are the property of their respective owners.